Top 6 Chart Patterns for Crypto Trading [Guide]
Essential charting patterns like wedges, double tops, flags and triangles trading strategies
![Top 6 Chart Patterns for Crypto Trading [Guide]](/content/images/size/w1200/2024/07/Top-trading-patterns.png)
Introduction
In our last blog, we took a look at what Technical Analysis is all about and the different types of candlestick charts that traders utilise to trade. The key idea behind analysing these charts is that recurring patterns can signal trading opportunities, which is where candlestick or chart patterns come into play. These patterns have been well-documented by traders across both long-term and short-term charts.
While chart patterns have faced criticism as their effectiveness often hinges on the number of market participants observing and acting on the same patterns, turning them into self-fulfilling prophecies, if it works it works.
So, in this blog, we'll guide you in recognising a few essential chart patterns to help you kickstart your trading journey!
Chart Patterns
We'll be going over 5 different chart patterns that are famous and those are: Rising and Falling wedges, Double tops and bottoms, Bullish and bearish flags, Ascending and descending triangles, Head & Shoulders and its inverse.
Before we enter into the world of chart patterns, let's understand a bit about the price action that follows these patterns. Price can be either trending or ranging.
A trending chart will make higher highs and lows in the case of an uptrend or lower highs and lows in the case of a downtrend while a ranging chart will make equal highs and lows or compressing highs and lows. Such movement in price is vital in seeing what type of charting pattern we have.
If you're looking for a lightning-fast Perps DEX, GooseFX is your destination!
Wedges
A wedge is formed when price is trending but the momentum is slowing down i.e in the case of an uptrend, the highs are rising at a slower rate than the lows meaning that a reversal might be coming as the trend is getting weaker. In case of a downtrend momentum slowing down, it means that the lows are falling at a slower rate than the highs indicating weakness in the downtrend.
Rising Wedge
A rising wedge is a type of wedge pattern that signals potential weakness in an uptrend, making it a bearish pattern. This pattern suggests that the price is likely to break through the lower trend line and decline.
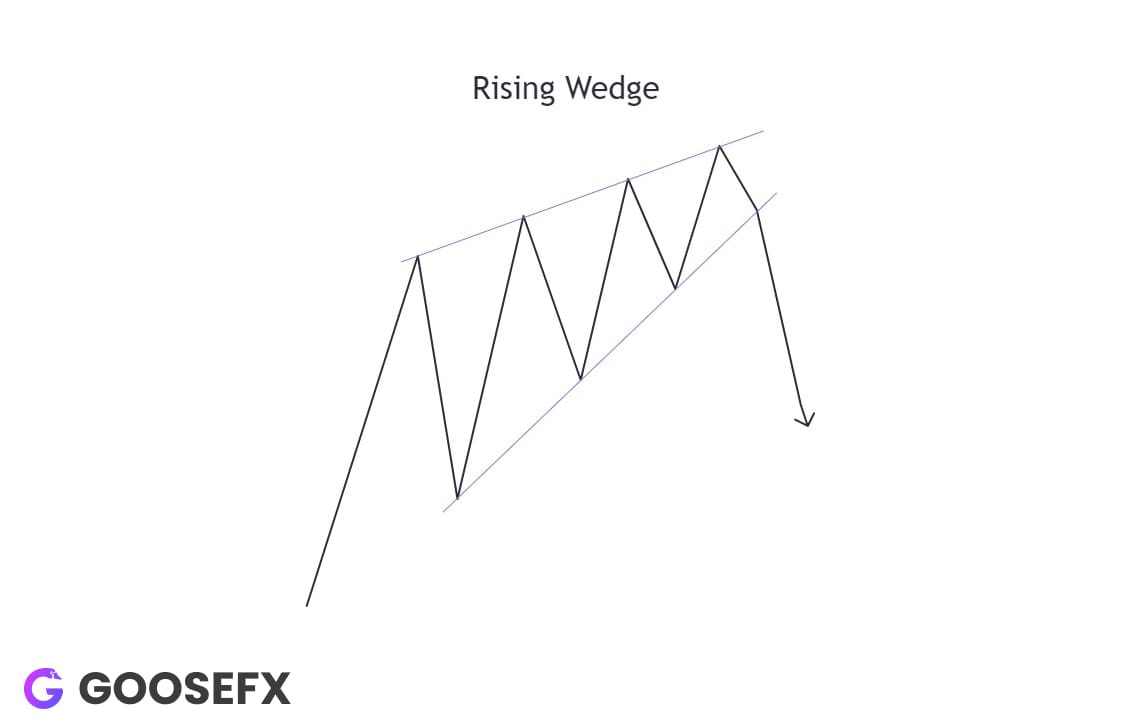
Traders can position themselves short or bet against the asset, and profit if the price falls as predicted.
Falling Wedge
On the other hand, a falling wedge is the latter wedge pattern that signals potential reversal of a bearish trend or downtrend making it a bullish pattern. This pattern suggests that the price is likely to break through the upper trend line and rise in the future.
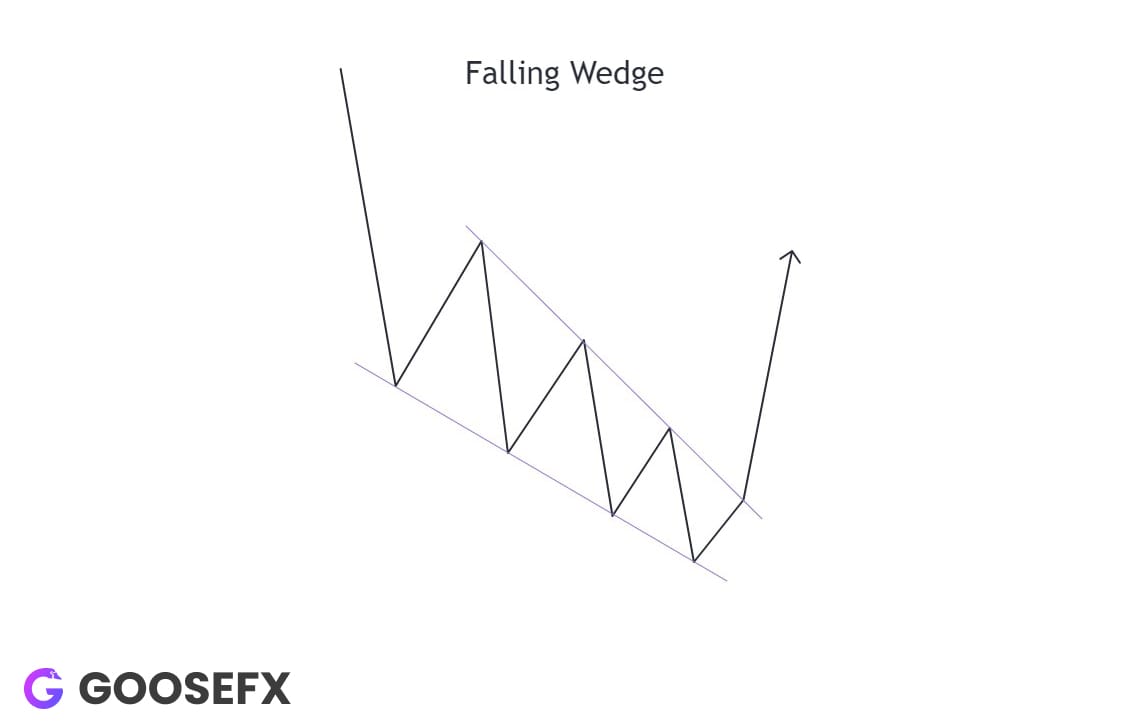
To profit off of this, traders can either buy the asset or long the asset on futures which means betting on the asset and profit if the price rises as predicted.
Double Tops and Bottoms (M or W)
Double tops or bottoms are chart patterns in which the price is ranging and moves making equal highs in case of double top or equal lows in case of double bottom. Do note that the highs or lows don't have to be exactly equal but close to each other and should be accompanied by higher volume than the other times.
Double Tops or M pattern
The double top is a bearish pattern that signals the end of an uptrend. It forms when the price reaches two equal highs but fails to push higher, indicating exhausted momentum. The pattern is confirmed when the price breaks below the low formed before the second high.
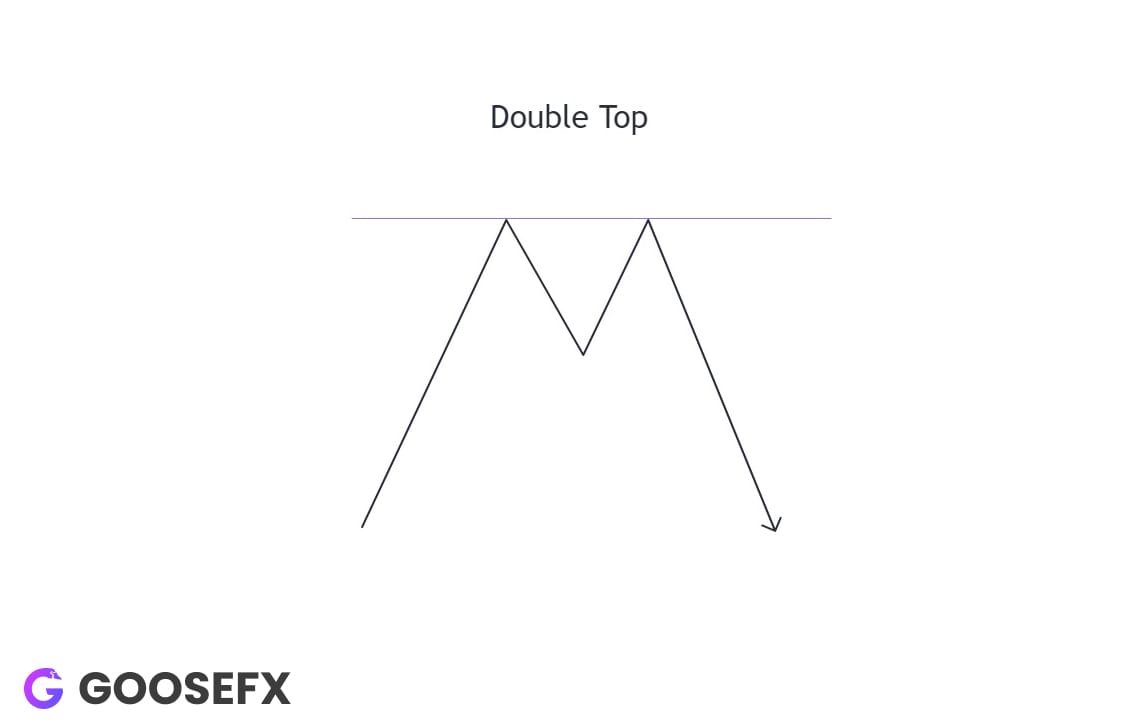
Traders can capitalise on this setup by going short, making profit if prices decline as expected.
Double Bottoms or W pattern
The double bottom is a bullish pattern that signals the end of a downtrend. It forms when the price hits two equal lows but fails to go lower, indicating exhausted selling pressure. The pattern is confirmed when the price breaks above the high formed between the two lows.
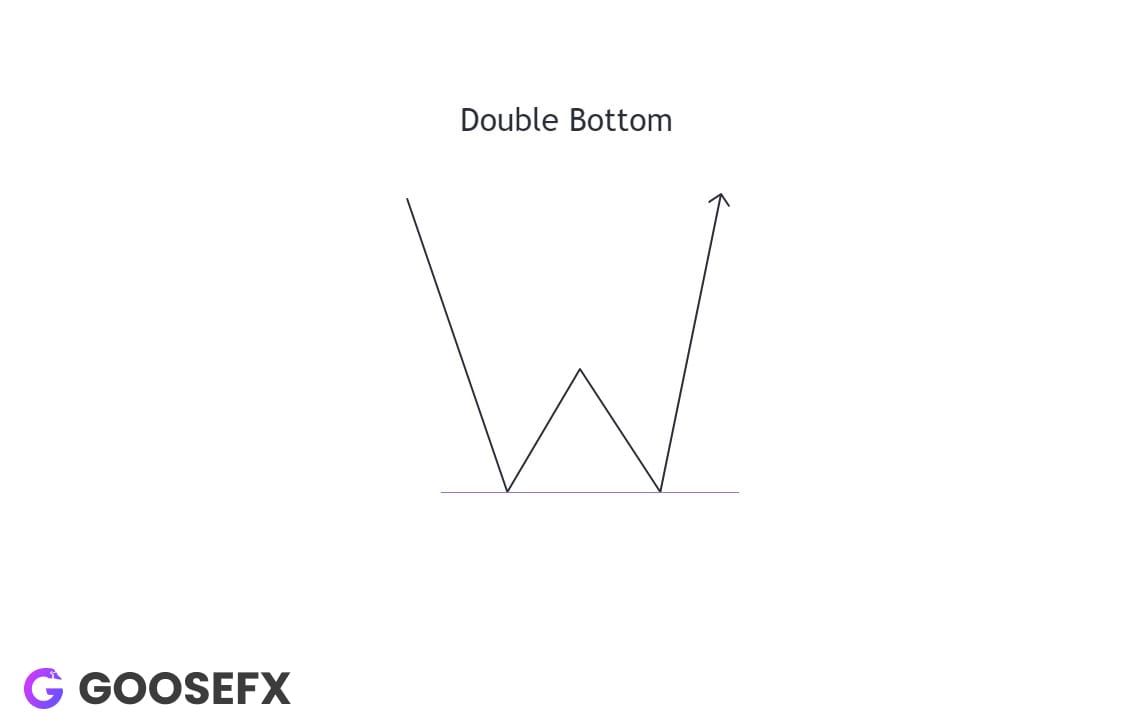
Traders can capitalise on this setup by going long, positioning themselves to profit if price rises as expected.
Flags
A flag is a consolidation area that moves against the direction of the longer-term trend and occurs after a sharp price movement. It resembles a flag on a flagpole, where the pole represents the impulse move and the flag represents the consolidation area.
Accompanying this pattern is a decrease in volume during consolidation while increase in volume during impulse moves. Flags are of two types depending upon the longer term trend - Bullish and Bearish Flags.
Do note that flags unlike the above two patterns are trend continuation patterns i.e price in an uptrend will remain in an uptrend while it is vice-versa for downtrend.
Eager to try out these trading patterns? Visit GooseFX and get started!
Bullish Flag
A bullish flag as the name suggests is an uptrend continuation pattern where we have a rising impulsive move followed by a low-volume downtrend consolidation leading to a high-volume uptrend impulse again.
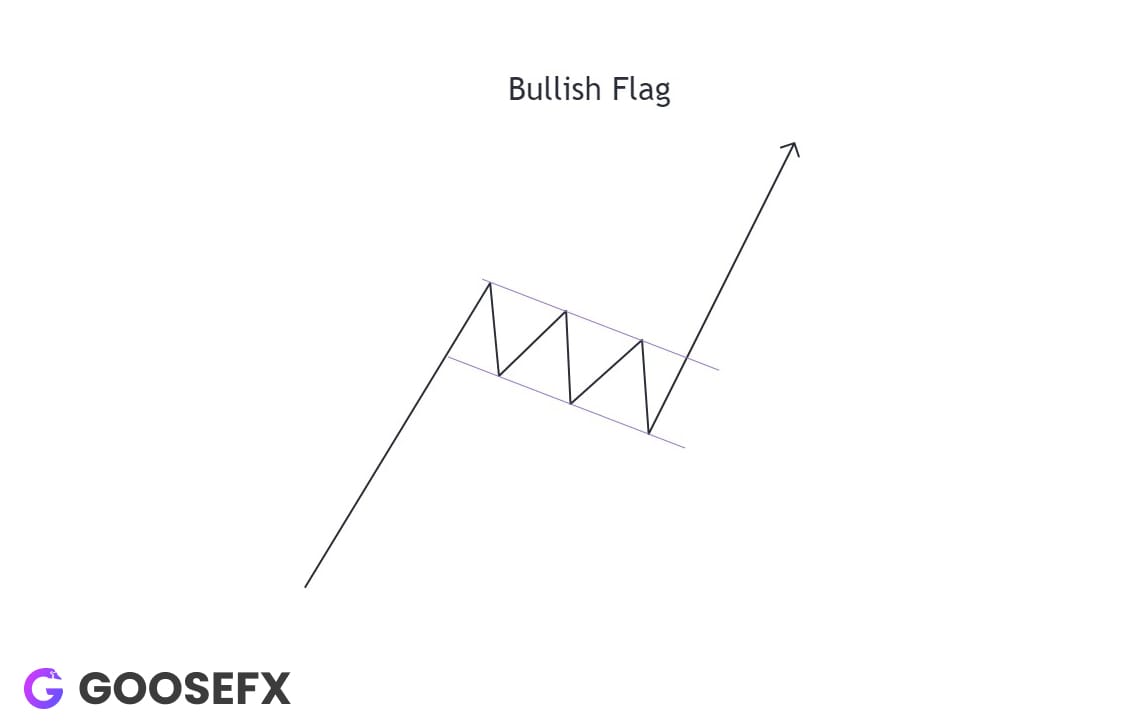
Traders can position themselves as long upon the break of the consolidation and capture profit if prices move up impulsively as expected.
Bearish Flag
A bearish flag, on the other hand, is a downtrend continuation pattern where we have a sharp, high-volume downward move followed by a low-volume upward consolidation. This is typically followed by another high-volume downward impulse.
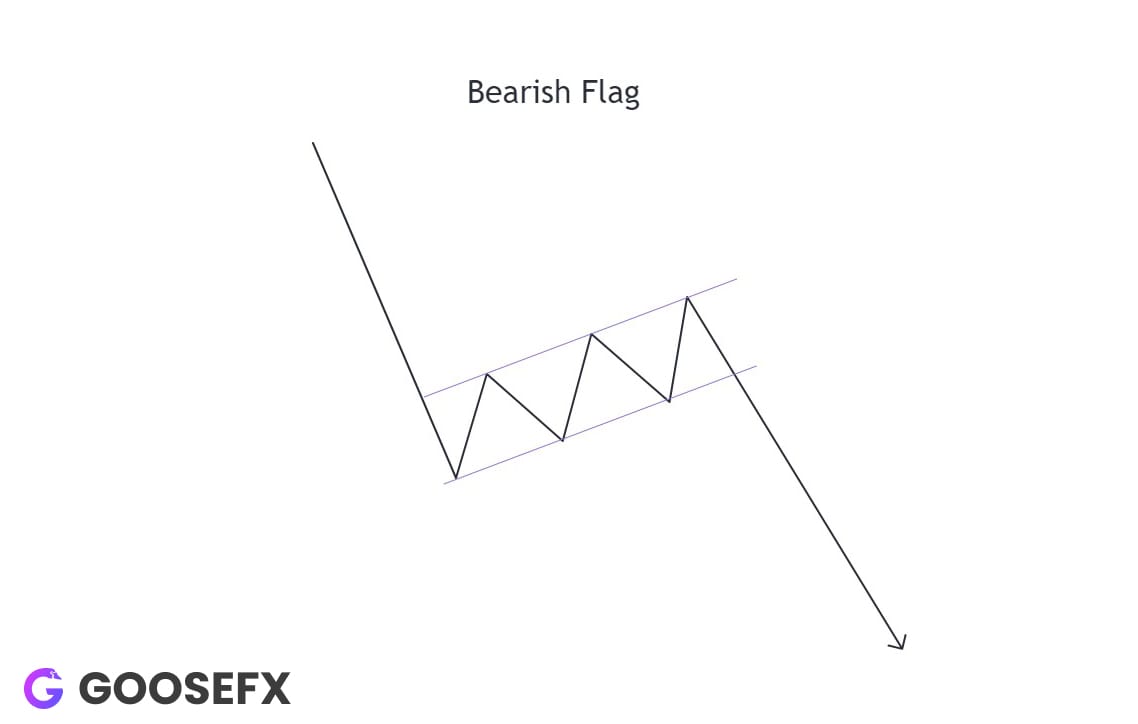
Traders can position themselves short upon the break of the consolidation and capture profit if prices move down impulsively as expected.
Triangles
Triangle chart patterns are formed due to compressing price action followed by a break in either direction. Based on the compression, there can be three types of triangles; Symmetrical Triangle , Ascending Triangle and Descending triangle.
Symmetrical Triangle
Symmetrical triangle patterns are formed when highs and lows both converge. They basically are similar to flags however with a triangular consolidation. These type of charting patterns are generally neutral in nature and can break either side.
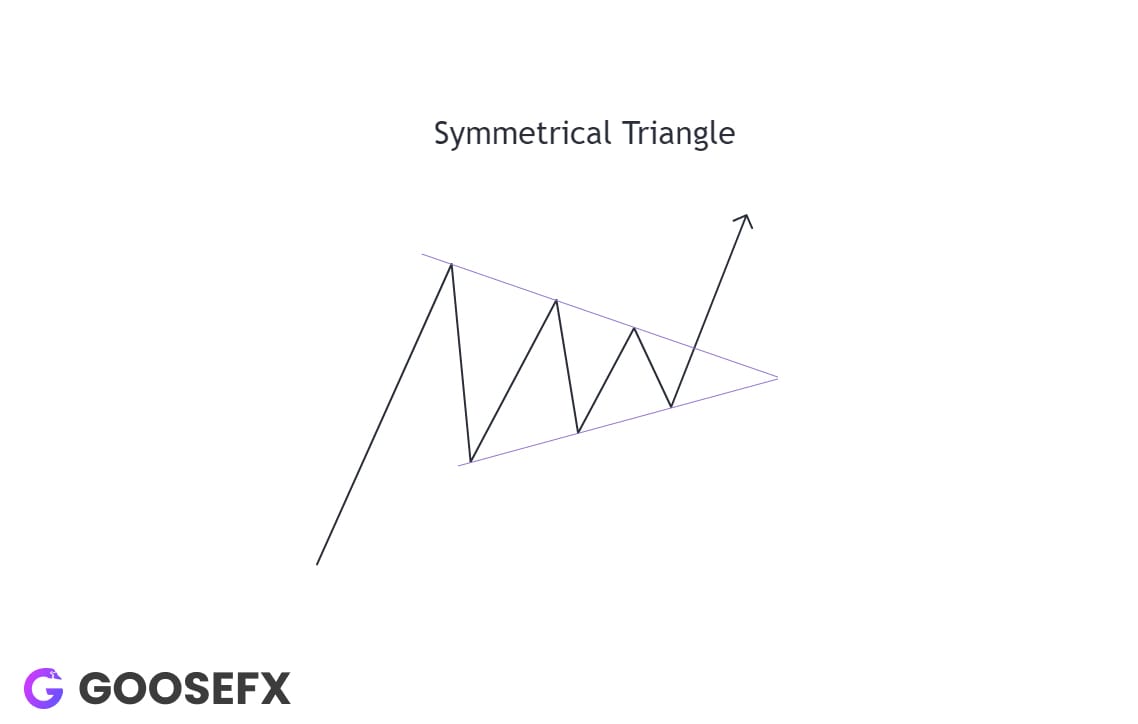
More information should be taken into consideration for a better interpretation of these patterns.
Ascending Triangle
Ascending triangles are an uptrend continuation pattern where you have higher lows with equal highs. In simple words, price falls from the same point of resistance however keeps making higher lows with every fall. This ultimately results in weakness of sellers or exhaustion of sellers thus continuing the impulsive rise.
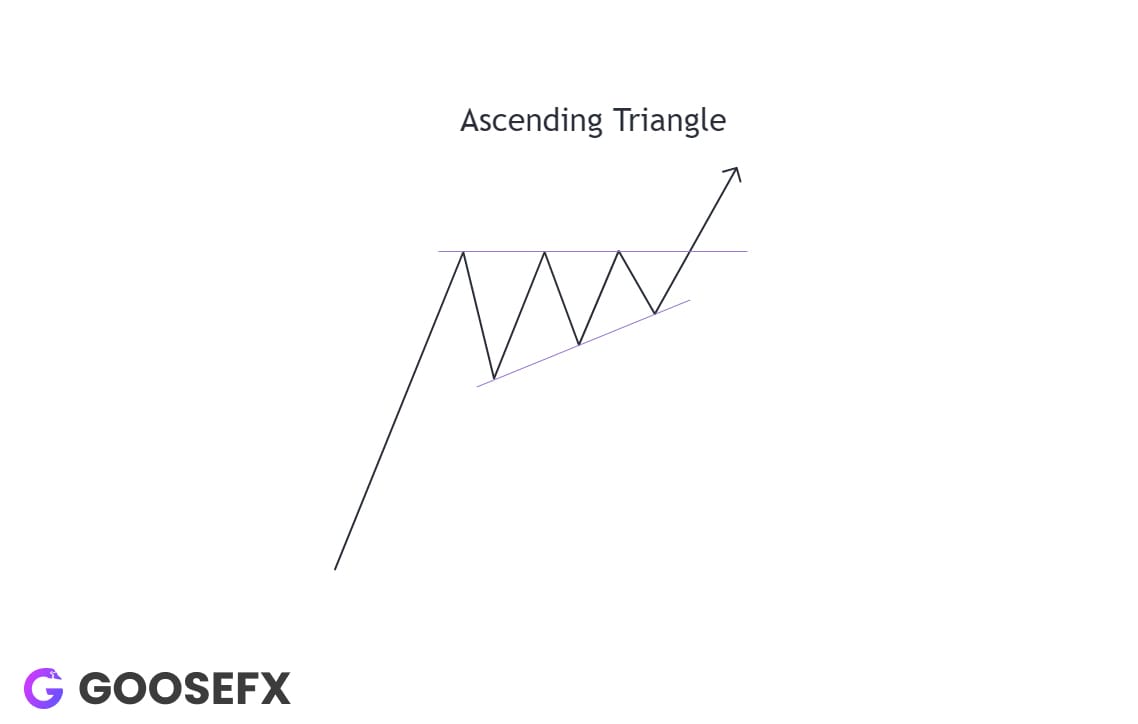
Traders can go long upon break of this triangle and profit if price rises as expected.
Descending Triangle
Descending triangles are a downtrend continuation pattern characterised by lower highs with equal lows. In simpler terms, price repeatedly bounces off the same support level while making lower highs with each bounce. This pattern indicates weakening buyer strength or buyer exhaustion, leading to a continuation of the downward impulse.

Traders can go short upon the break of this triangle and profit if the price falls as expected.
Head & Shoulders
The head and shoulders pattern is a bearish reversal pattern that typically forms at the end of an uptrend. It consists of three peaks: a higher peak known as the head with adjoining lower peaks or shoulders on either side of the head. This pattern indicates a weakening uptrend and the potential start of a downtrend.
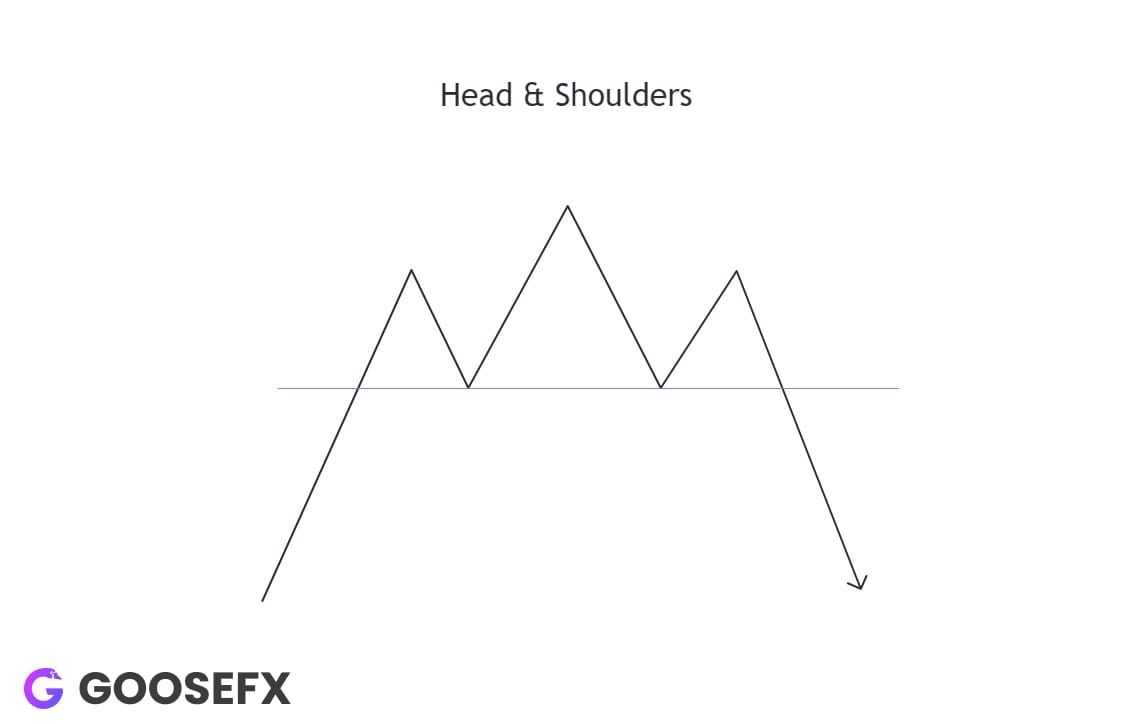
Traders can position themselves short upon the break of the neckline which is the support level connecting the lows between the head and shoulders and profit if the price falls as expected.
Spot a descending triangle or a head and shoulders pattern on SOL? Trade it with 10x leverage on GooseFX!
Inverse Head & Shoulders
As the name suggests it is inverse of the head and shoulders pattern i.e is a bullish reversal pattern that typically forms at the end of a downtrend. It consists of three troughs: a lower trough or the head flanked by two higher troughs or the shoulders.
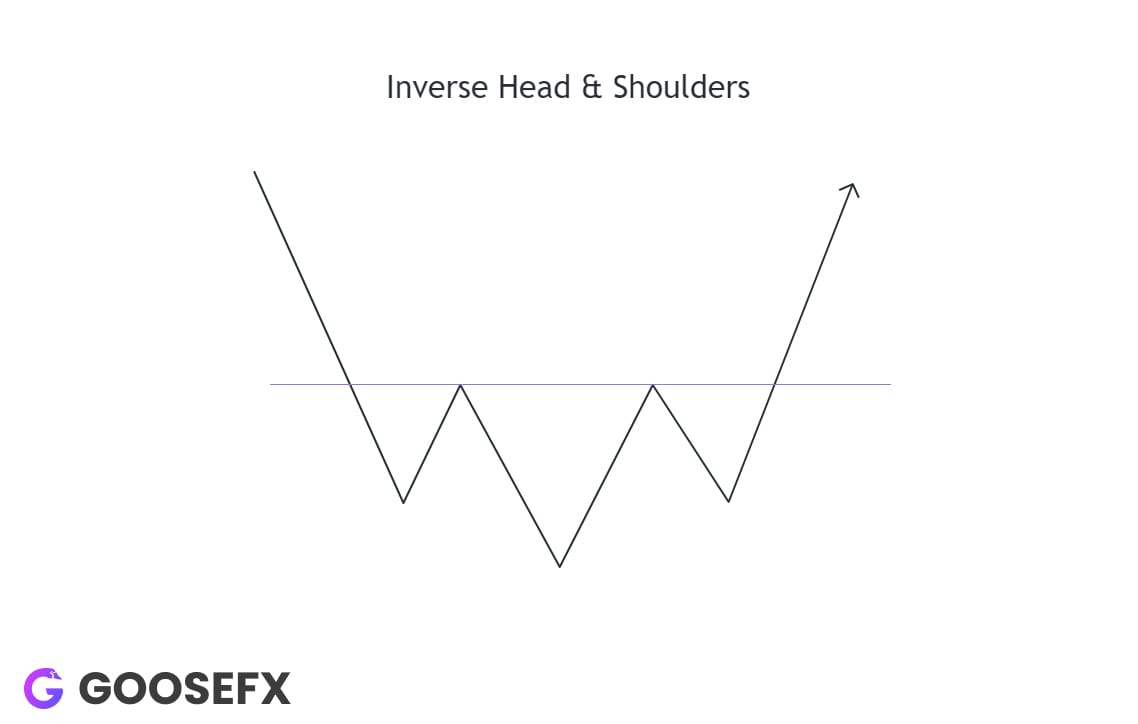
Traders can position themselves long upon the break of the neckline and profit if the price rises as expected.
Ending Thoughts
Charting patterns as shown above are just tools that a trader can use to base its trading decisions off of however, these should be utilised with other tools or indicators. To top it off, these should be accompanied by proper risk management which Intern has highlighted in our recent thread.
Markets have been wild this week, leading to the second major liquidation event since FTX.
— GooseFX (@GooseFX1) July 8, 2024
Times like these call for a step back to improve your risk management.
So, here are 5 tips from the Intern 👇 pic.twitter.com/j6OgS9U4Ik
Until we meet, trade safely anon!
Intern out
Stay Tuned with #GooseAcademy
Website | Twitter | Telegram | Discord | Docs
Disclaimer: The statements, proposals, and details above are informational only, and subject to change. We are in early-stage development and may need to change dates, details, or the project as a whole based on the protocol, team, legal or regulatory needs, or due to developments of Solana/Serum. Nothing above should be construed as financial, legal, or investment advice.

Comments ()